Since there are a lot of documentations about how to profile out there this is just a simple link list with usefull resources.
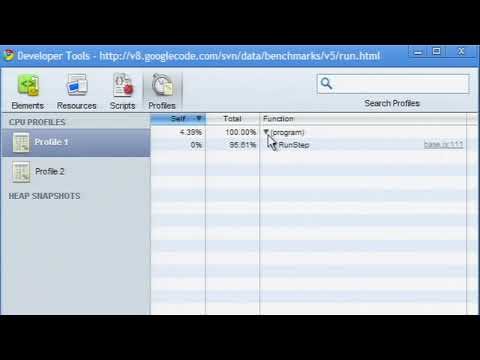
When the Chrome DevTools is open, calling this function starts a JavaScript CPU profile with an optional label.To complete the profile, call console.profileEnd(). Each profile is added to the Profiles tab. In the following example a CPU profile is started at the entry to a function that is suspected to consume excessive CPU resources, and ended when the function exits.
console.profile("foo");
/* code you want to profile */
console.profileEnd();Starts a new timer with an associated label. When console.timeEnd() is called with the same label, the timer is stopped the elapsed time displayed in the Console. Timer values are accurate to the sub-millisecond.
console.time("foo");
/* code you want to meassure */
console.timeEnd("foo")There are many third party tools available for profiling Node.js applications but, in many cases, the easiest option is to use the Node.js built in profiler. The built in profiler uses the profiler inside V8 which samples the stack at regular intervals during program execution. It records the results of these samples, along with important optimization events such as jit compiles, as a series of ticks:
Easy profiling for Node.js Applications
- https://nodejs.org/en/docs/guides/simple-profiling/
- https://developers.google.com/v8/profiler_example
- Speed Up JavaScript Execution | Web Tools - Google Developers
- Fix Memory Problems | Web Tools - Google Developers
- Chrome Profile Overview
- "Google I/O 2012 - Breaking the JavaScript Speed Limit with V8" on YouTube
- "Google Chrome Developer Tools: Profiling and optimizing" on YouTube
- "Detecting Memory Leaks Using Chrome Developer Tools" on YouTube