A NodeJS API serving user provided home thermostat setting statistics from PostgreSQL to an AngularJS front end, with SmartyStreets ZIP Code lookups and jVectorMap data visualization.
This app was written out of curiosity about people's heating and cooling habits and a desire to work with map-based informational display.
- Install NodeJS
- Install PostgreSQL
- Sign up for a free SmartyStreets API access
- Start PostgreSQL
- Clone down this repository
- In a terminal within the repository directory:
- Set your SmartyStreets Secret Keys as environment variables
- Your key's Auth ID as
AUTHID - Your key's Auth Token as
AUTHTOKEN
- Your key's Auth ID as
- Install required Node modules by running
npm install - Install required Bower components by running
./node_modules/.bin/bower install - Generate the jVectorMap script by running
./public/vendor/jvectormap/build.sh - Install the jVectorMap script by running
mv jquery.jvectormap.min.js public/vendor/jvectormap/ - Start the server by running
node server.js
- Set your SmartyStreets Secret Keys as environment variables
- In the browser of your choice, go to
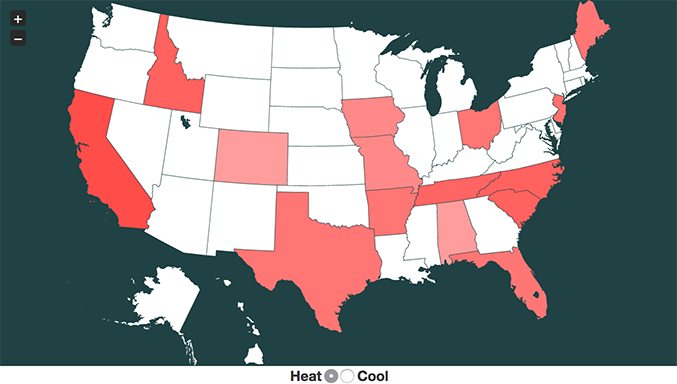
http://localhost:3000. - Click any state on the map to open the data entry modal window.
- Radio buttons at the bottom of the page switch display between heating and cooling values.
- States will change their color values based on the relative average heating and cooling values.
- Mousing over a state which has data will display the average heating and cooling values.
http://localhost:3000/api- same as/api/detail.http://localhost:3000/api/detail- full listing of all data.http://localhost:3000/api/detail/<state>- full listing of all data for the<state>provided as the state's 2-letter abbreviation.http://localhost:3000/api/detail/<state>/<county>- full listing of all data for the<county>provided by name in the<state>provided by 2-letter abbreviation.http://localhost:3000/api/summary- listing of data summarized by state for all states in the database.http://localhost:3000/api/summary/<state>- listing of data summary for the<state>provided by 2-letter abbreviation.http://localhost:3000/api/summary/<state>/<county>- listing of data summary for all entries for the<county>provided by name in the<state>provided by 2-letter abbreviation.