This project demonstrates a quantitative momentum investing strategy that selects the 50 stocks with the highest price momentum from the S&P 500. The strategy involves calculating the recommended trades for an equal-weight portfolio of these 50 stocks, as well as a more advanced high-quality momentum strategy.
- Introduction
- Library Imports
- Importing Stock Data
- Making API Calls
- Filtering High Momentum Stocks
- Calculating Shares to Buy
- Advanced Momentum Strategy
- Saving to Excel
- Calculating Returns
- Investment Strategy using 80-20 Principle
- Visualizing Returns
- Acknowledgements
"Momentum investing" means investing in stocks that have increased in price the most. This project builds an investing strategy that selects the 50 highest price momentum stocks and calculates recommended trades for an equal-weight portfolio of these stocks.
The project utilizes the following libraries:
numpypandasrequestsmathscipy.statsxlsxwriter
Make sure to install the required libraries.
pip install numpy pandas requests xlsxwriter scipyWe import a list of S&P 500 stocks from a CSV file.
The project uses the IEX Cloud API to fetch one-year price returns for each stock.
The top 50 stocks by one-year price return are selected and sorted.
A function calculates the number of shares to buy for each selected stock based on the given portfolio size.
The strategy is refined by considering high-quality momentum, selecting stocks from the highest percentiles of:
- 1-month price returns
- 3-month price returns
- 6-month price returns
- 1-year price returns
The results are saved to an Excel file using xlsxwriter, with formatted columns for better readability.
Momentum investing involves selecting stocks that have shown the highest price increase over a specific period. This project uses various timeframes to determine the momentum and quality of the stocks:
- 1-month price returns
- 3-month price returns
- 6-month price returns
- 1-year price returns
An alternative investment strategy based on the 80-20 principle is implemented. In this strategy, 80% of the portfolio size is allocated to the top 20% of stocks based on the HQM (High-Quality Momentum) Score, and the remaining 20% of the portfolio size is allocated to the rest of the stocks.
The code iterates through the stocks in hqm_dataframe and calculates returns for each timeframe (one month, three months, six months, and one year) using the 80-20 allocation principle. For the top 20% of stocks, 80% of the portfolio size is allocated, and for the remaining 80% of stocks, 20% of the portfolio size is allocated.
Ensure to adjust the portfolio_size variable as per your portfolio setup before running the code.
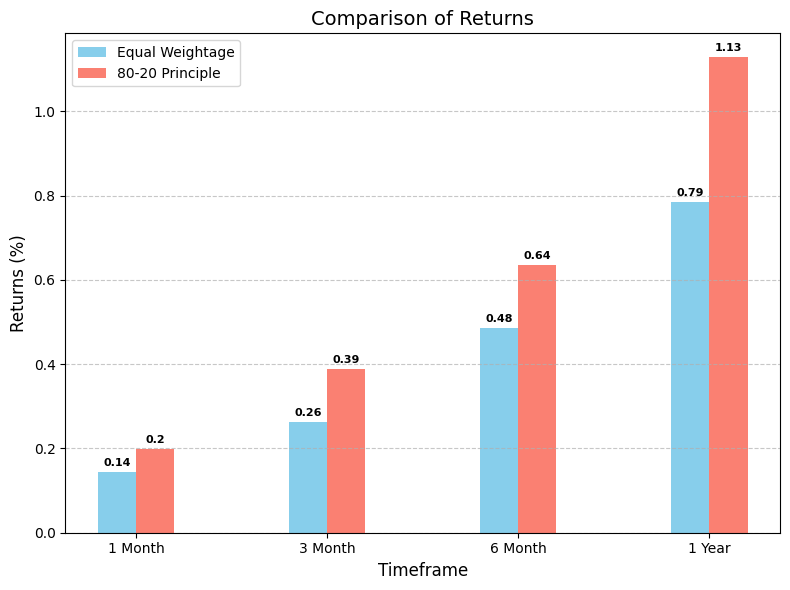
The project includes a section to visualize and compare the returns of two different investment strategies:
- Equal Weighting: Allocating an equal amount of capital to all selected stocks.
- Unequal Weighting (80-20 Principle): Allocating 80% of the portfolio to the top 20% of stocks based on the HQM Score, and 20% to the remaining 80% of stocks.
To visualize the returns, the project uses matplotlib to generate a bar graph showing the returns for different timeframes (1 month, 3 months, 6 months, and 1 year).
The steps to generate the visualization include:
- Calculate Returns: Compute the returns for each selected stock over the specified timeframes.
- Aggregate Returns: Aggregate the returns for the entire portfolio under both strategies.
- Plot the Graph: Use
matplotlibto create a bar graph comparing the returns of the two strategies.
By visualizing the returns, you can easily compare the performance of the equal-weight and 80-20 principle strategies across different timeframes.
The following graph shows the comparison of returns over different timeframes using the 80-20 investment strategy:
This project was developed using the following resources and libraries:
- IEX Cloud API
- pandas library
- numpy library
- scipy library
- xlsxwriter library
- matplotlib library
- Special thanks to the creators of the open-source libraries used in this project.