mapcolorizer.js is a Javascript jQuery plugin that produces an interactive choropleth map: colorized polygons on top of a map that user can interact with.
The plugin depends on jQuery and Leaflet.
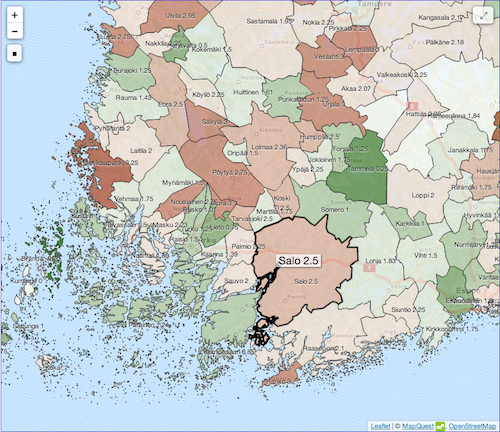
See plugin live at kuntakartta.org - the site displays statistical data of 320 communes of Finland. The site is only in Finnish.
The full sources to the demo site appear in the
site folder. The
site can be run locally with the Python script run-wwwserver.sh in the site
folder.
- GeoJSON polygon data.
- JSON statistical data.
- Simple colorization: even color scale or 2 scales: below and above average.
- No background image, 1 static image or tile servers.
- Full screen mode.
- Hover shows polygon name.
- Click on polygon pans and zooms to it.
- Zoom in, out and fit to screen.
- Customizable via creation options.
- Plus features of Leaflet.
In your HTML, include the required CSS and Javascript files:
<html>
    <head>
        <link rel="stylesheet" href="css/leaflet.css">
        <link rel="stylesheet" href="css/mapcolorizer.css">

        <script src="js/jquery.min.js"></script>
        <script src="js/leaflet.js"></script>
        <script src="js/mapcolorizer.js"></script>
    </head>
    <body>
        <div id="mymap"></div>
    </body>
</html>
In your Javascript, create a basic map with MapQuest tile server:
var options = {url_geoson: "data/polygons.geojson"};
var map = $("#mymap").mapcolorizer(options).data("mapcolorizer");
map.init(function() {
    map.setTileServer("mapquest");
    map.loadData("data.json");
});The polygon coordinates are feeded in as GeoJSON. GeoJSON is a simple, popular format based on JSON that is easily consumable by Javascript.
The GeoJSON file is loaded via AJAX from the specified URL.
The GeoJSON polygon properties must contain a code attribute. It
must be a string. This identifier is used to link the polygon to the
statistical data. The name displayed on hover comes from properties.name.
Leaflet provides good support for various types of map backgrounds. The map can contain just the polygons and no background. Or the map can have a single background image that is just resized on user zoom. The advantage of these is that the map can be used without a tile server: no license/bandwidth issues and works in offline.
The third option is to use a real tile server. Popular options are MapQuest, OpenStreetMap and CloudMade. Be aware that heavy usage of these services may require licensing.
The statistical data is also in JSON format but separate from the coordinate
data. It's a simple JSON object that has a code and value for each polygon.
Sample data file:
{
    "area738": 18.00,
    "area935": 18.50,
    "area211": 17.83,
    "area781": 18.00,
    "area263": 18.50,
    "area785": 19.00,
    "area700": 16.00,
    "area702": 17.75,
    "area178": 18.00,
    "area707": 18.50
}The coloring routine is simple: when the data is loaded, the plugin calculates the min/max/avg of the data and scales the data range over the given color scale.
There are 2 scaling modes:
- 1: evenly scale the data range over the color scale
- 2: two scales, green scheme below average and red scheme above average
The plugin has a built-in 9 color scheme from green to red. You may give your your own colorscheme as an option during creation.
Most likely the routine is a bit primitive, but you have the sources, go ahead and improve it!
Here are the options that can be given during map creation:
var defaults = {
    url_geoson: "", // url to fetch geojson polygons
    style_func: styleFunc, // styles for areas
    style_hover: {weight: 3, color: "#000"}, // hover style
    min_zoom: 3, // min zoom level
    max_zoom: 9, // max zoom level
    show_full_screen_toggle : true, // show fullscreen toggler
    on_click: onClick, // event handler
    on_mouse_over: onMouseOver, // event handler
    on_mouse_out: onMouseOut, // event handler
    scale_mode: 2, // color scale count: 1 or 2
    color_scale: color_scale10, // array of colors
    overlay_opacity: 1, // background image/tiles opacity
    area_list: null // list of area ids to show, null=all
};The plugin provides the following API:
// Initialize the plugin. Callback is called when geojson is loaded.
function init(cb) {}

// Load JSON data. If data is a string, it is an URL to the JSON
// file to be loaded. If data is an object, it is used directly.
// Callback is called when data is loaded.
function loadData(data, cb) {}

// Set tile server type: osm,mapquest,cloudmade,custom.
// If custom, options specifies options.
function setTileServer(type, options) {}

// Set a background image.
function setImage(url, coords) {}

// Show or hide names of polygons. The name is centered in the middle
// of the polygon.
// showvalue: append the data value after name.
function showNames(show, showvalue) {}

// Zooms to fit all polygons in map.
function zoomToFit() {}

// Set function that returns a JSON object that defines the
// style of polygons.
function setStyle(func) {}

// Add legend for the map as HTML.
function setLegend(html) {}

// Let map resize itself if map size is changed.
function refresh() {}

// Provide access to internal objects, for quick hackability.
function getSelf() {}
Style options are document here.
This folder contains GeoJSON polygon data for Finland's 320 communes, and various statistical data in raw and JSON format.
conv.py is a Python script I used to convert the raw .csv data to JSON format.
The plugin should have the same browser support as Leaflet.